Big Cities, Big Business: Bangkok, London and Paris lead the way as Mastercard brings together tourism and city partners to improve experiences for visitors
In a world of rising nationalism, international travel takes on greater importance – breaking down barriers, broadening our horizons and driving economic impact felt throughout the world’s cities. For the past decade, Mastercard’s Global Destination Cities Index has offered important analysis of travel to and within cities. This year’s top cities are Bangkok, London and Paris, once again underscoring the importance of robust infrastructure, both business and leisure attractions and strong local culture.
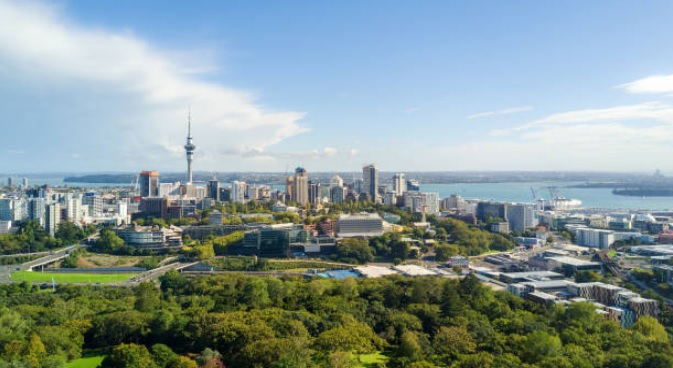
This year Auckland features in Mastercard’s Global Destination Cities Index for the first time, taking 44th spot for overnight visitors in the city, with tourists staying an average of 23.4 nights. The City of Sails also featured in the top 50 for tourist expenditure per day ($129 USD), ranking 49th of the 162 countries surveyed.
“While Auckland has long been an important hub for tourists transferring to other parts of New Zealand, including Queenstown and Rotorua, its inclusion in the top 50 of Mastercard’s Global Destination Cities Index shows it is fast becoming a destination in its own right. Offering a mix of beautiful beaches and scenic landscapes combined with a unique collection of multicultural and contemporary urban centres, Auckland has a lot to offer and is an increasingly desirable destination,” said Ruth Riviere, Mastercard Country Manager for New Zealand and the Pacific Islands.
The Mastercard Index, which expanded this year to look at 162 cities, is not simply a ranking of the top travel destinations. Based on visitor volume and spend for the 2017 calendar year, the in-depth analysis also provides a growth forecast for the remainder of 2018 and – for the first time – a view into average length of stay and amount spent per day.
With the global economy buzzing, the annual growth of international overnight visitors to the Top 10 destination cities was up from the previous Mastercard Index except for Seoul, which saw a dip. The forecast for the remainder of 2018 indicates across-the-board growth, with Istanbul expecting the largest uptick in visitors.
With roughly 20 million international overnight visitors, Bangkok remains in the top spot this year and is unlikely to be bested due to strong projected growth of 9.6 percent for 2018. Interestingly, visitors tend to stay in Bangkok 4.7 nights and spend $173 USD per day, on average.
The Global Top 10 Destination Cities
| 2017 International Overnight Visitors | Growth Forecast for 2018 | Av Length of Stay (nights) | Av Spend Per Day (USD) | |
| Bangkok | 20.05 million | 9.6% | 4.7 | $173 |
| London | 19.83 million | 3.0% | 5.8 | $153 |
| Paris | 17.44 million | 2.9% | 2.5 | $301 |
| Dubai | 15.79 million | 5.5% | 3.5 | $537 |
| Singapore | 13.91 million | 4.0% | 4.3 | $286 |
| New York | 13.13 million | 4.1% | 8.3 | $147 |
| Kuala Lumpur | 12.58 million | 7.5% | 5.5 | $124 |
| Tokyo | 11.93 million | 1.6% | 6.5 | $154 |
| Istanbul | 10.7 million | 19.7% | 5.8 | $108 |
| Seoul | 9.54 million | 6.1% | 4.2 | $181 |
However, not all cities are created equal when it comes to the amount visitors spend in the local economy. Dubai continues to be the top-ranking destination city based on overnight visitor spend, a whopping $537 USD per day on average. It is joined in the Top 10 with newcomers Makkah, Saudi Arabia, which debuts in the number two spot, Palma de Mallorca, Spain, and Phuket, Thailand. Of the most visited cities, Istanbul comes in with the lowest spend per day at $108 USD on average.
Top Cities by Dollars Spent
| 2017 IVO Spend (USD) | Forecast for 2018 | Average Spend by Day (USD) | |
| Dubai | 29.7 billion | 7.8% | $537 |
| Makkah | 18.45 billion | 7.4% | $135 |
| London | 17.45 billion | 13.7% | $153 |
| Singapore | 17.02 billion | 7.4% | $286 |
| Bangkok | 16.36 billion | 13.8% | $173 |
| New York | 16.1 billion | 4.1% | $147 |
| Paris | 13.05 billion | 16.0% | $301 |
| Palma de Mallorca | 11.96 billion | 16.2% | $220 |
| Tokyo | 11.91 billion | 7.8% | $154 |
| Phuket | 10.46 billion | 12.6% | $239 |
Forecasts are based upon the weighted average of the national level tourism forecasts and the actual 2018 monthly data at the destination level, which is available to the latest month before release.